citation network
Project
An interactive citation graph mapping how closely AI-explanation research and design’s comprehension research actually cite each other.
Target Users
Anyone doing synthesis work who needs to show a field’s structure, not just summarize its sources.
Pain Points
Citation gaps between fields are usually invisible — buried in reference lists, asserted in prose, hard for a reader to verify directly.
Make a bibliometric pattern — how connected two literatures are — visible and explorable, rather than just stated.
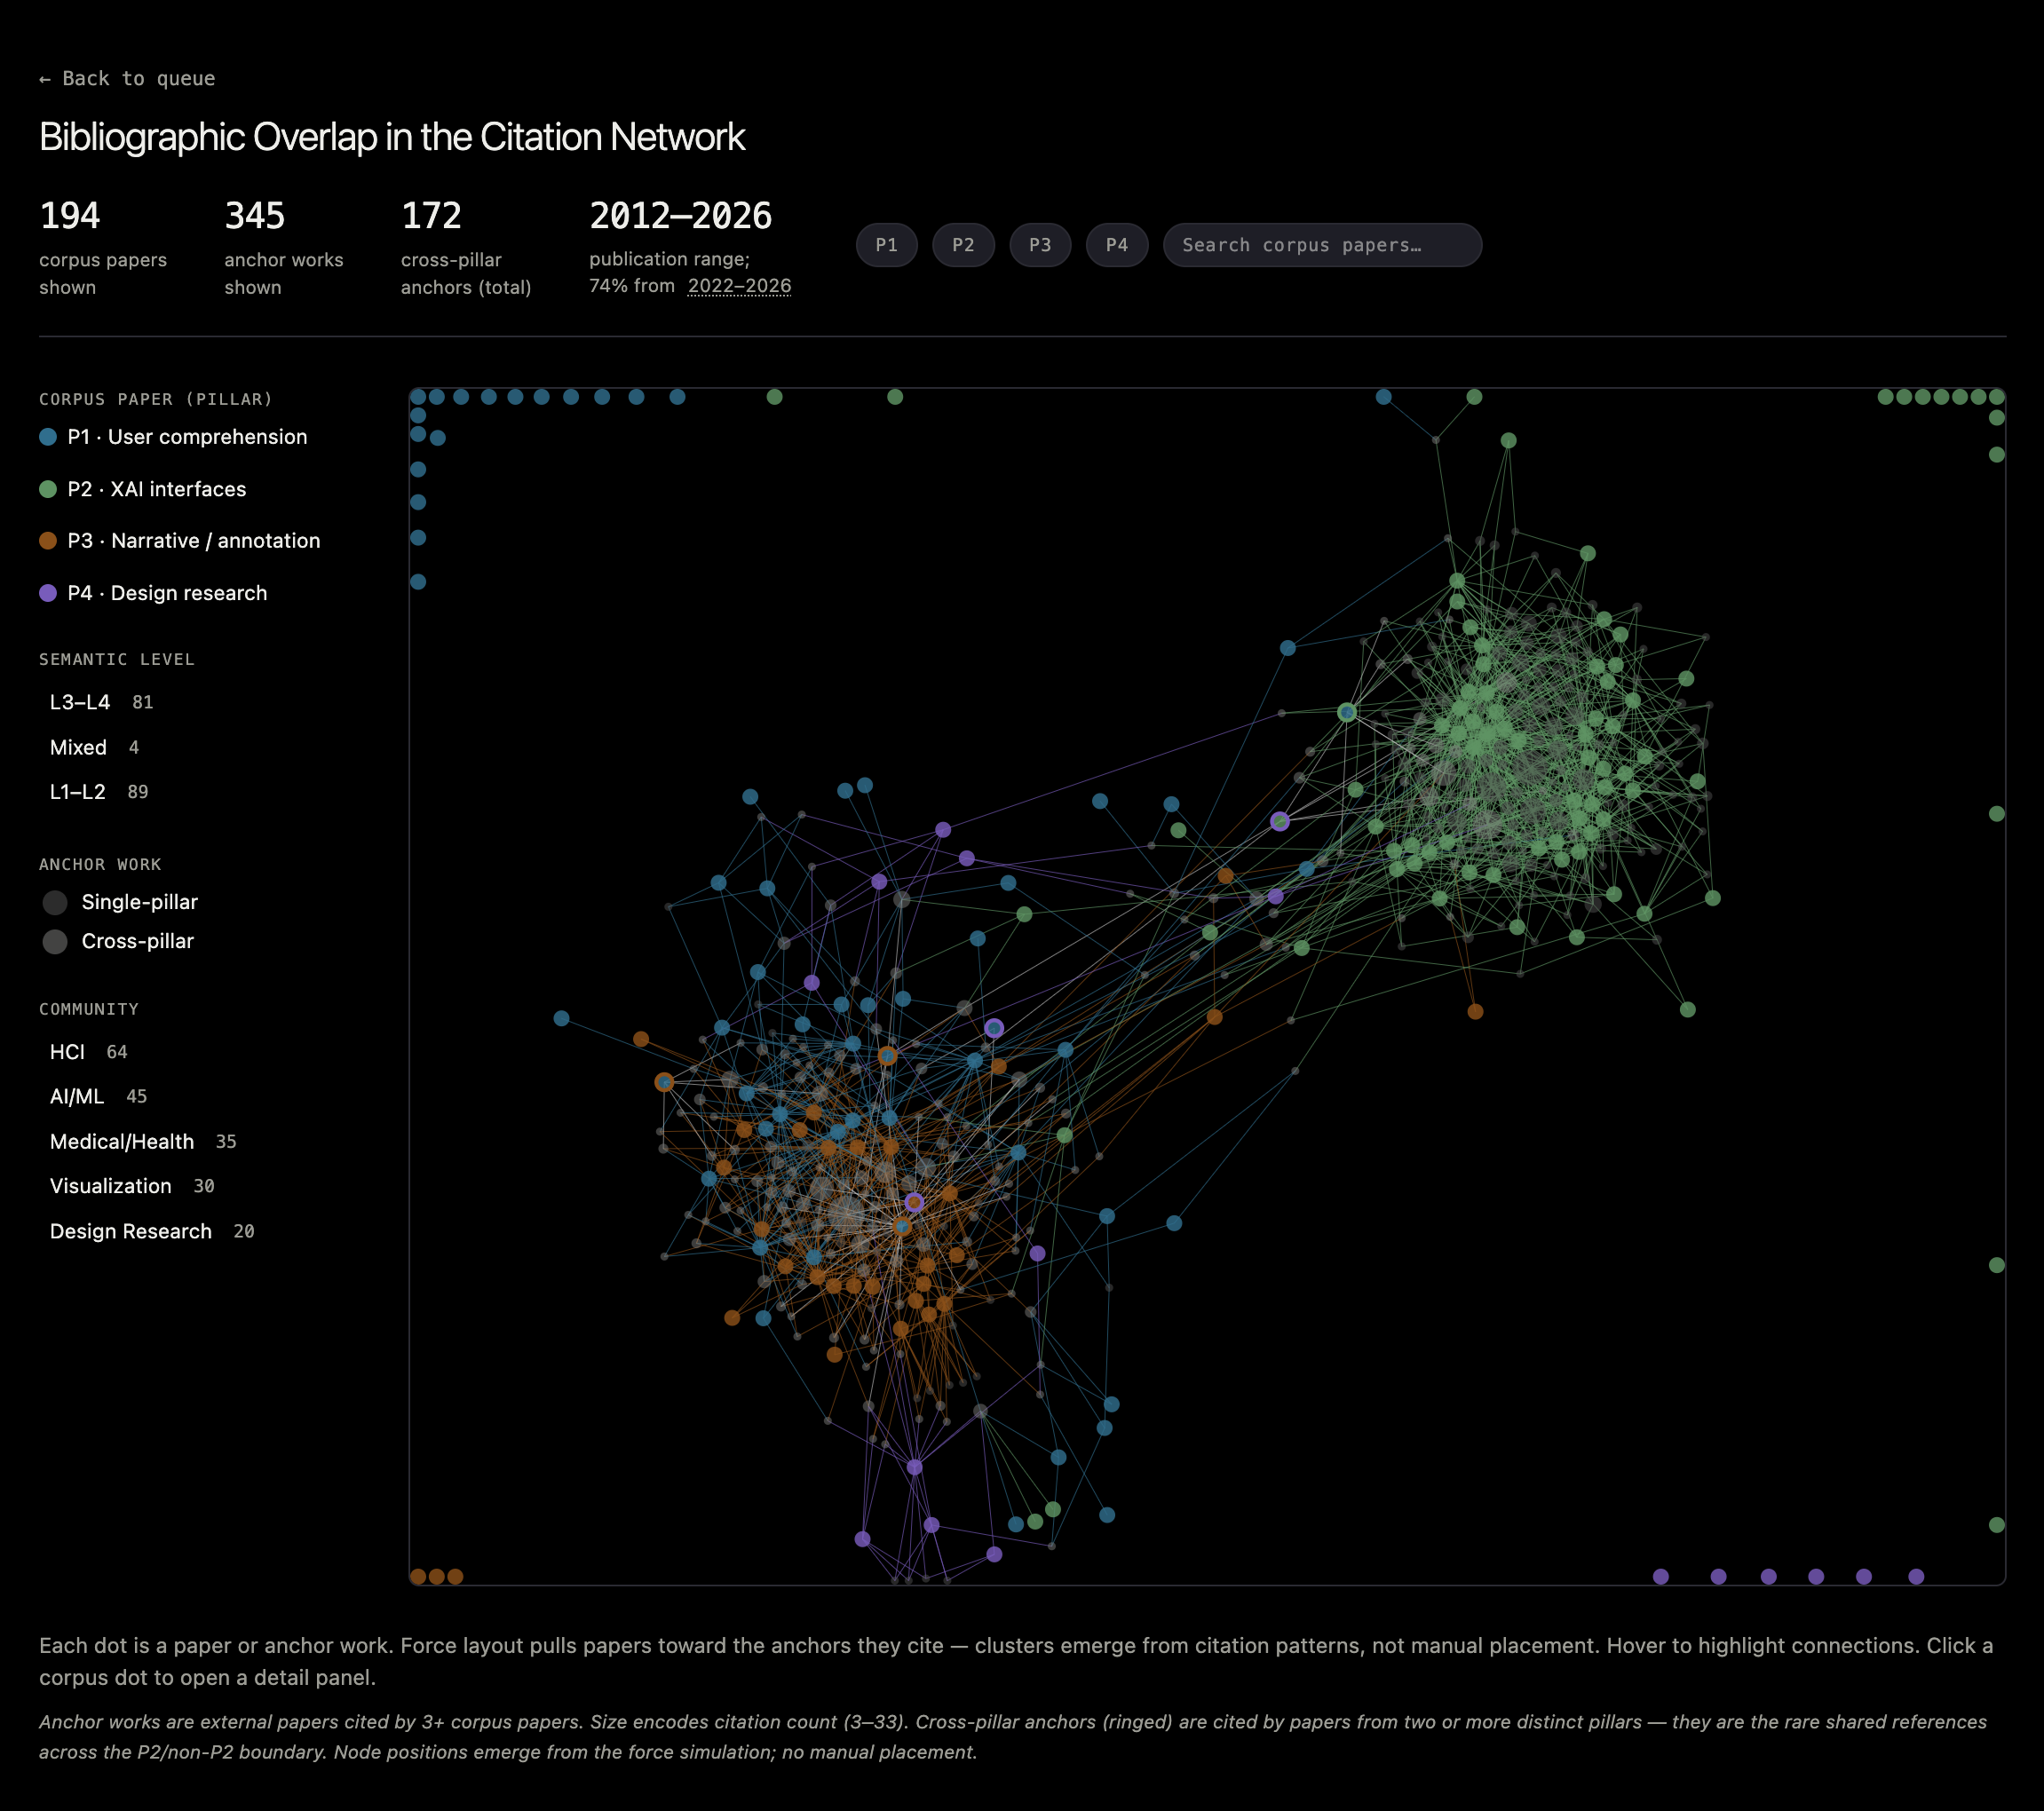
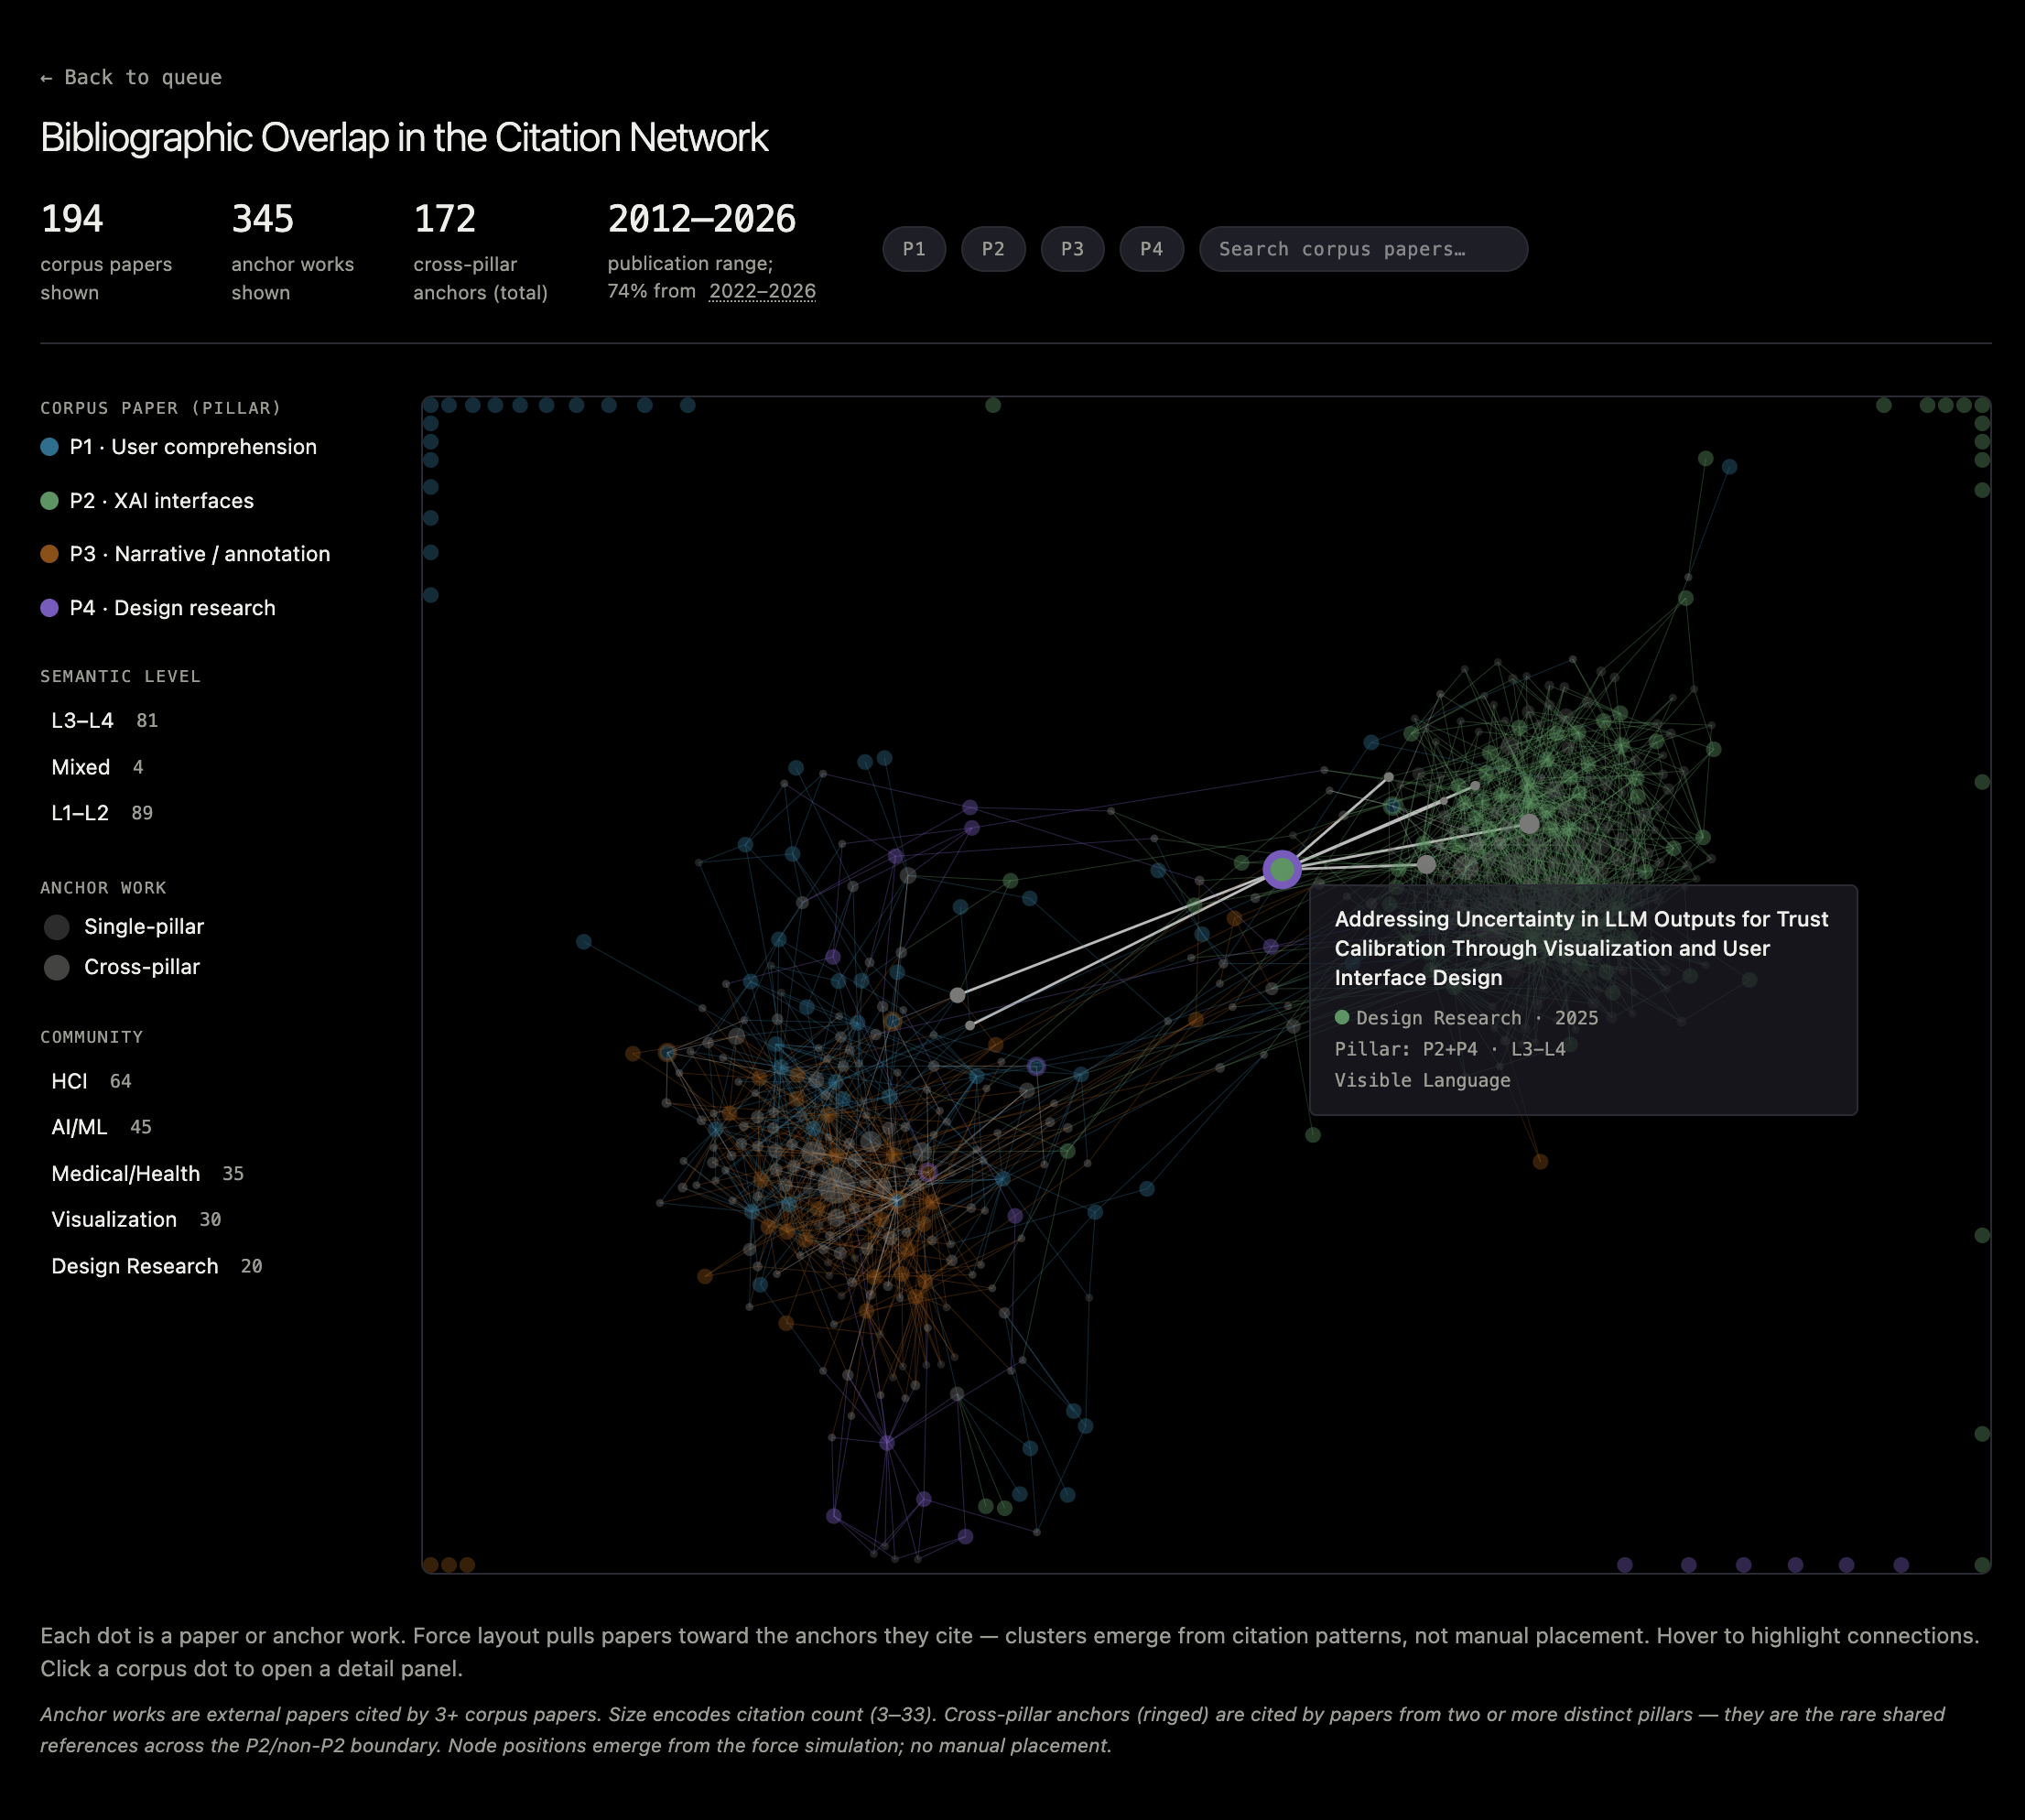
How much does research on AI-explanation interfaces draw on what design already knows about comprehension — narrative, annotation, how people move from reading a chart to understanding it? This graph doesn’t assert an answer; it shows one. The AI-interface literature forms a dense, self-contained cluster, sharing markedly fewer citations with the design and visualization research most relevant to it than that research shares within itself.
Position Is the Data
- Force-directed layout where position is data — proximity reflects shared citations, not manual grouping.
- Papers colored by field, so cluster membership is legible at a glance.
- Cross-field anchors — works cited across communities — sized and visually flagged as the bridges between clusters.
- Hover and filter interaction to isolate a single field’s citation footprint, or trace exactly which papers a given bridge work connects.
The Four Fields, Briefly
The corpus draws on four search pillars: visualization comprehension research, XAI interface design, narrative and annotation mechanisms, and design research reached by hand-search. The latter three are largely design’s own territory; the citation gap this graph surfaces is specifically between XAI interfaces and that broader design/comprehension literature.
Why the Layout Matters
No node position was set by hand. Each paper’s placement is the output of a force simulation — papers are pulled toward what they share citations with, and pushed apart from what they don’t. So when the AI-interface cluster resolves as visibly separate from the rest, that separation wasn’t designed in; it emerged from a few hundred papers sorting themselves by their own reference lists. That’s what makes the graph evidence rather than illustration.
194 corpus papers · 345 anchor works · 172 cross-pillar anchors · 1,624 citation edges · 2012–2026 publication range
Seeing the Gap
The finding reads as one sentence: XAI interface research shares markedly fewer intellectual anchors with the design and visualization literature most relevant to it than that literature shares within itself. As a graph, it’s immediate — a dense, self-contained AI-interfaces cluster, and a more integrated cluster of comprehension, narrative, and design-research work, connected by a comparatively thin bridge.
Reading the Bridges
Cross-field anchors — works cited by both clusters — are the graph’s evidence of partial connection. Hovering one highlights which papers on each side cite it, making it possible to trace exactly how, and how thinly, the two clusters are held together.